AWS Cloudwatch Monitoring & Alerts using Bash Scripts
Monitoring is critical to the smooth operation of production services. It enables you to recognize critical issues before they become catastrophic failures. We can also have a constant understanding of the health of our system.
Main benefits of cloud monitoring are:
-
Cost-effective : You can estimate the minimum resources required to run your workload with proper monitoring. It will allow you to avoid over-provisioning of resources while keeping costs low.
-
Reliability : Monitoring the resources allows you to estimate the amount of resources needed for optimal performance.
-
Scalability : It can assist you in determining when you need to increase or decrease your resource allocation.
-
Investigation : You can do root cause analysis of issues easily by narrowing down possible causes by looking at anomalies in historical monitoring data.
-
Alerting : You can prevent numerous system failures by having enough alerts about something that is happening or about to happen.
For EC2 Instances, AWS provides CPU Utilization Metrics by default.
High CPU utilization, Low Disk space available, and High Memory utilization are three basic alerts that every server should have.
Let’s see how you can quickly create a High CPU Utilization alert from AWS Console.
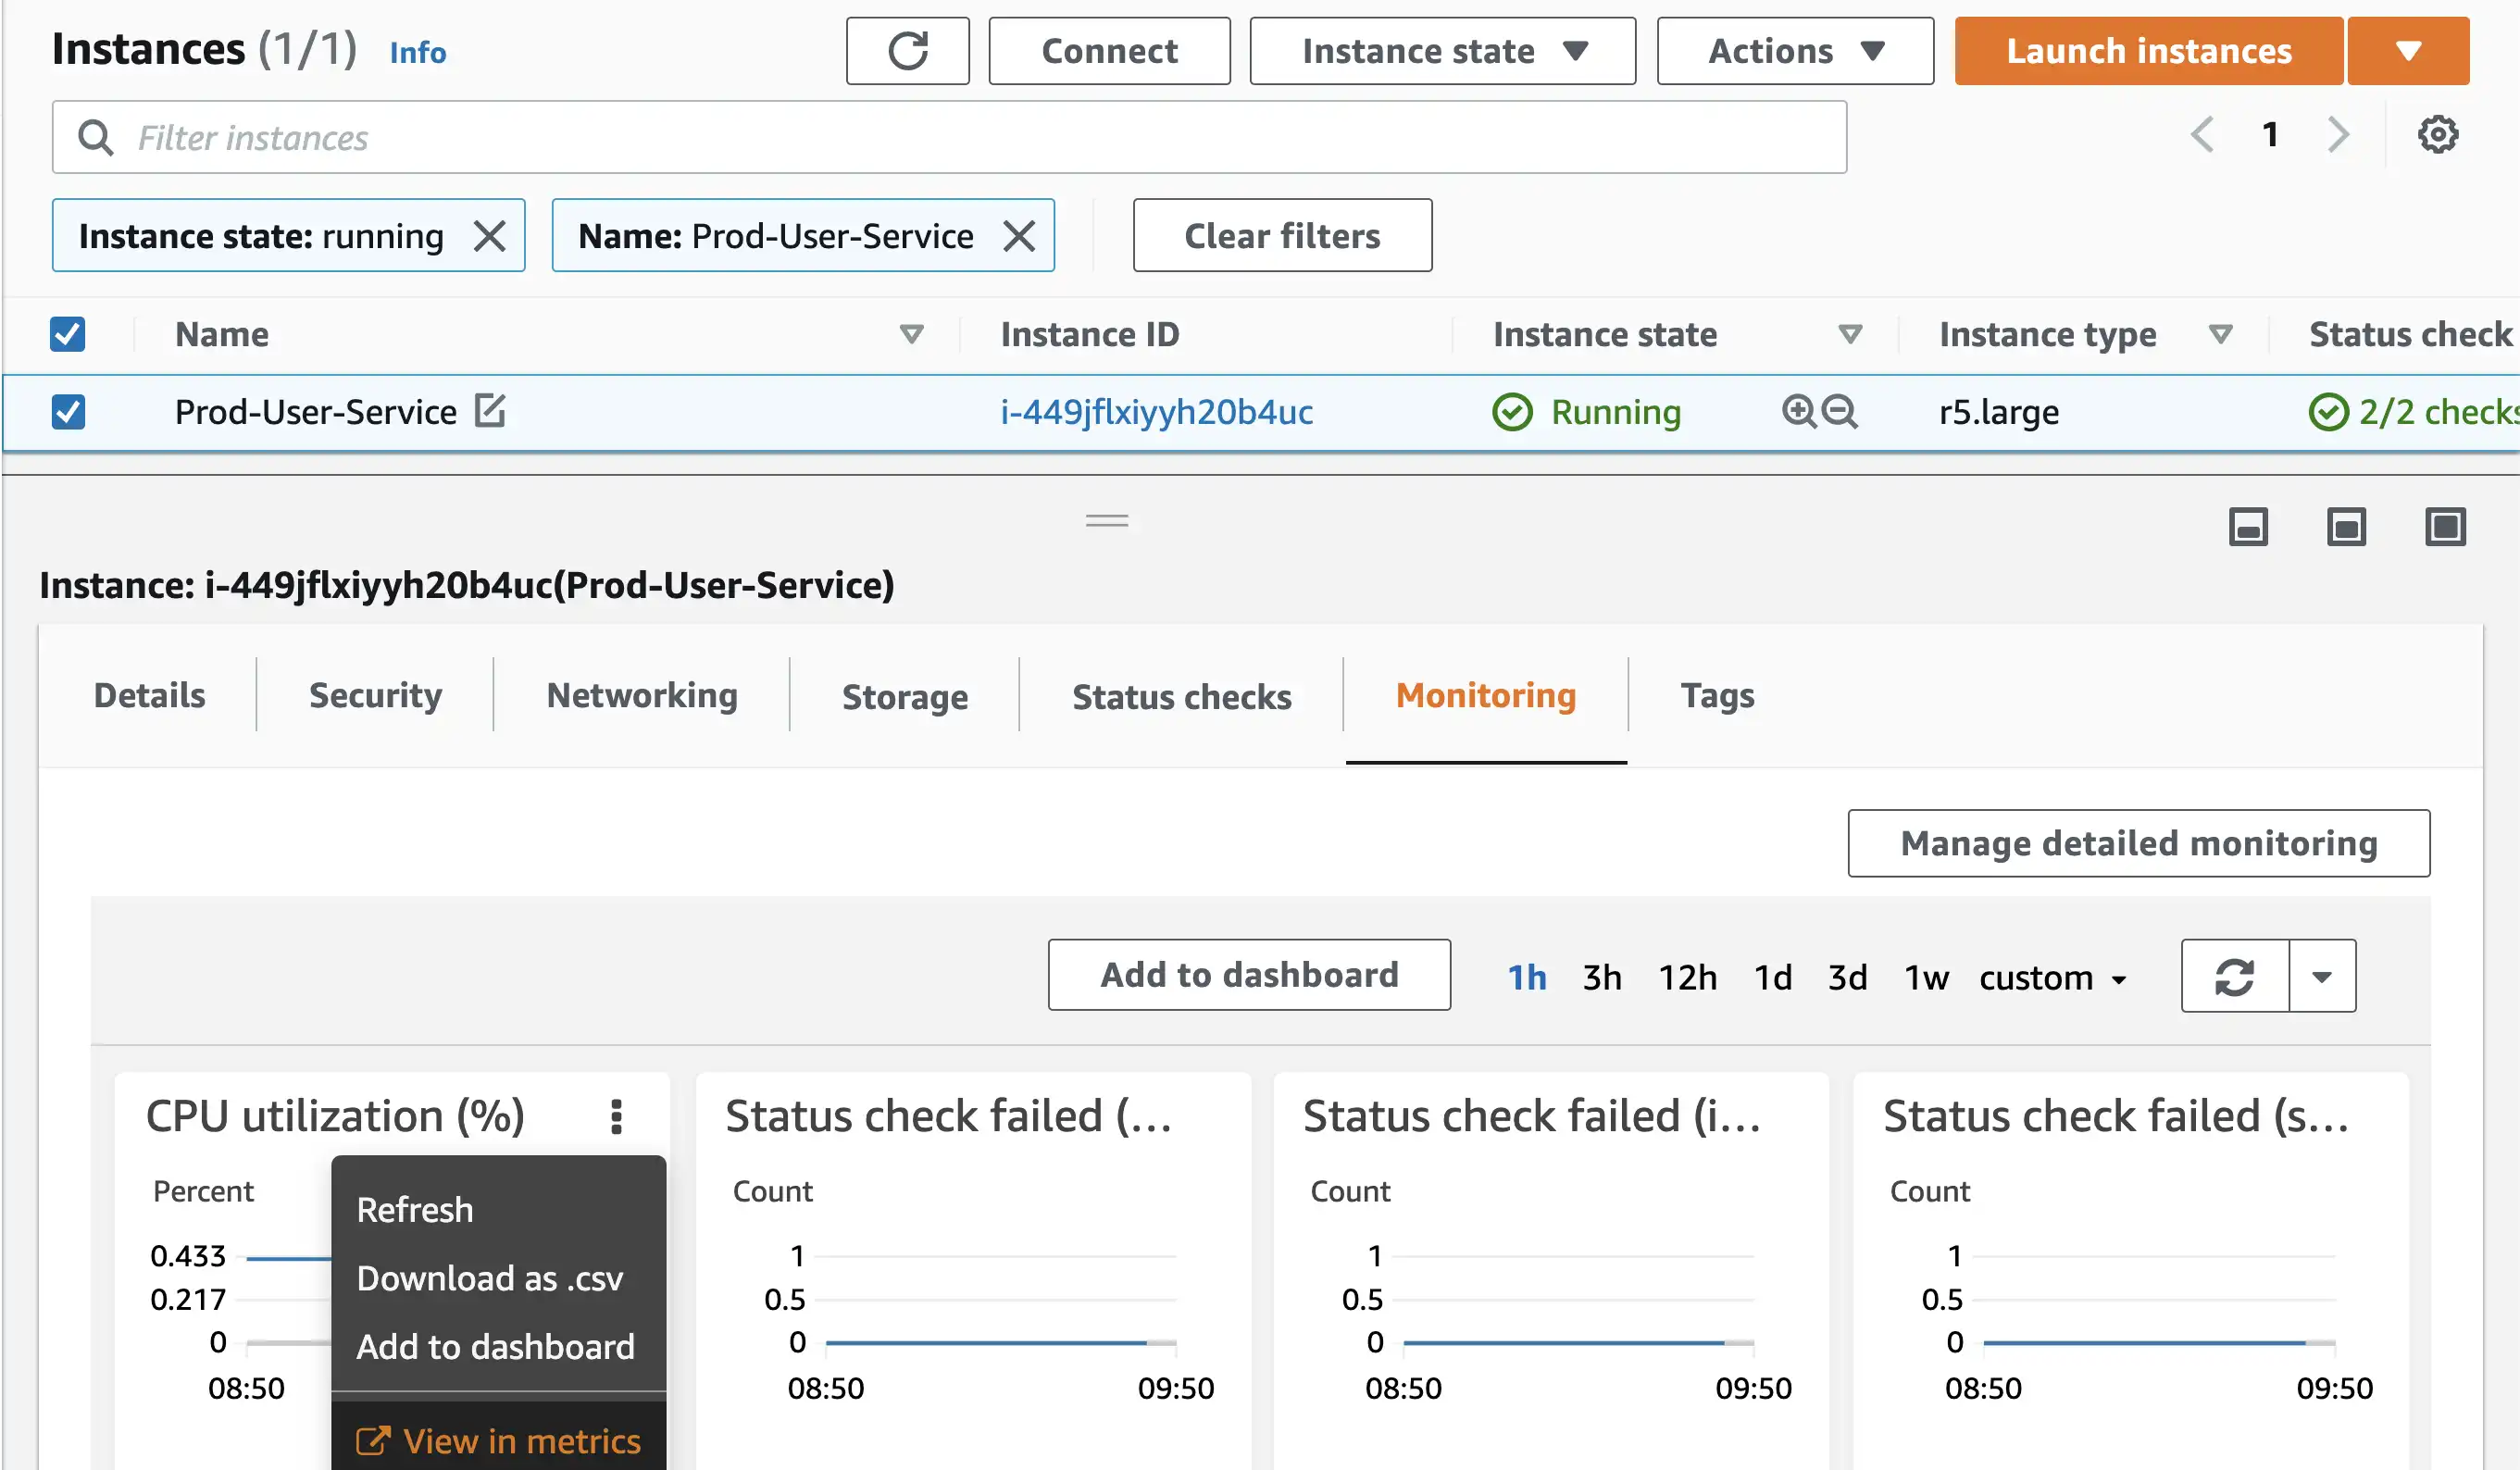
- First go to the EC2 instances section and select your instance.
- Select Monitoring tab in details panel.
- Click on 3 dots of CPU Utilization Card and select
View in Metrics
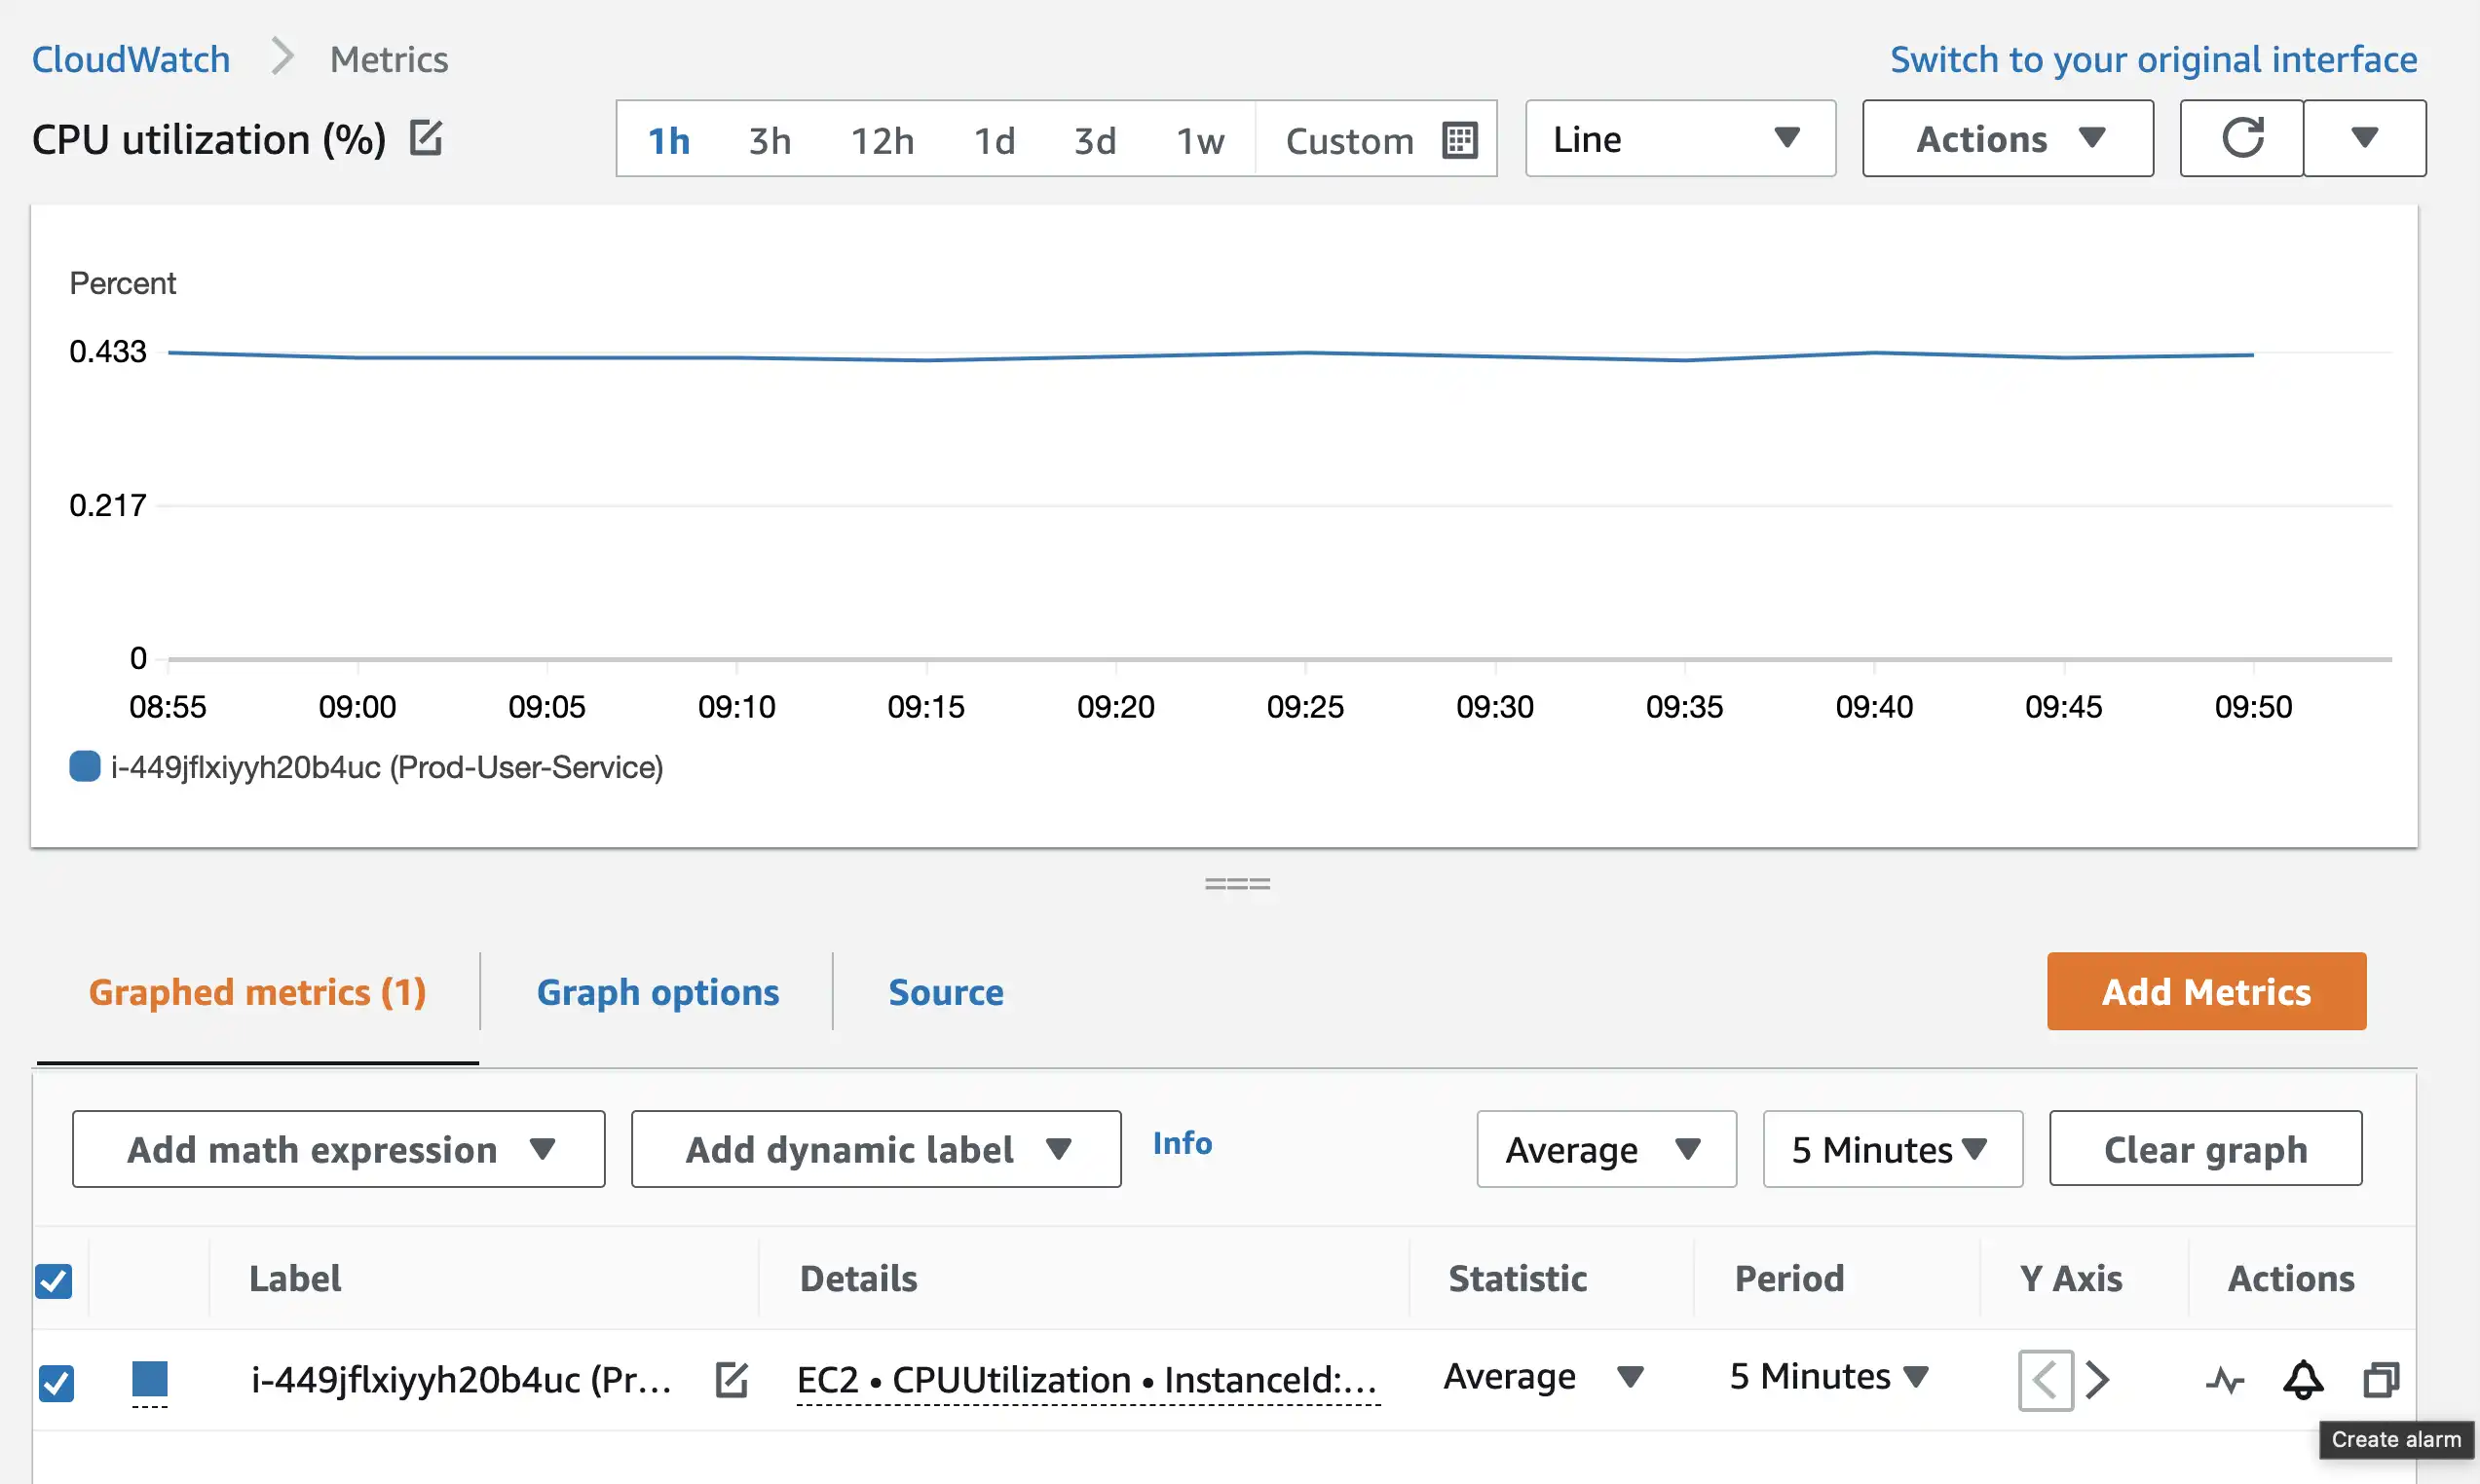
- On the graphed metrics page, click on the bell icon and a dialog for creating alarm will open.
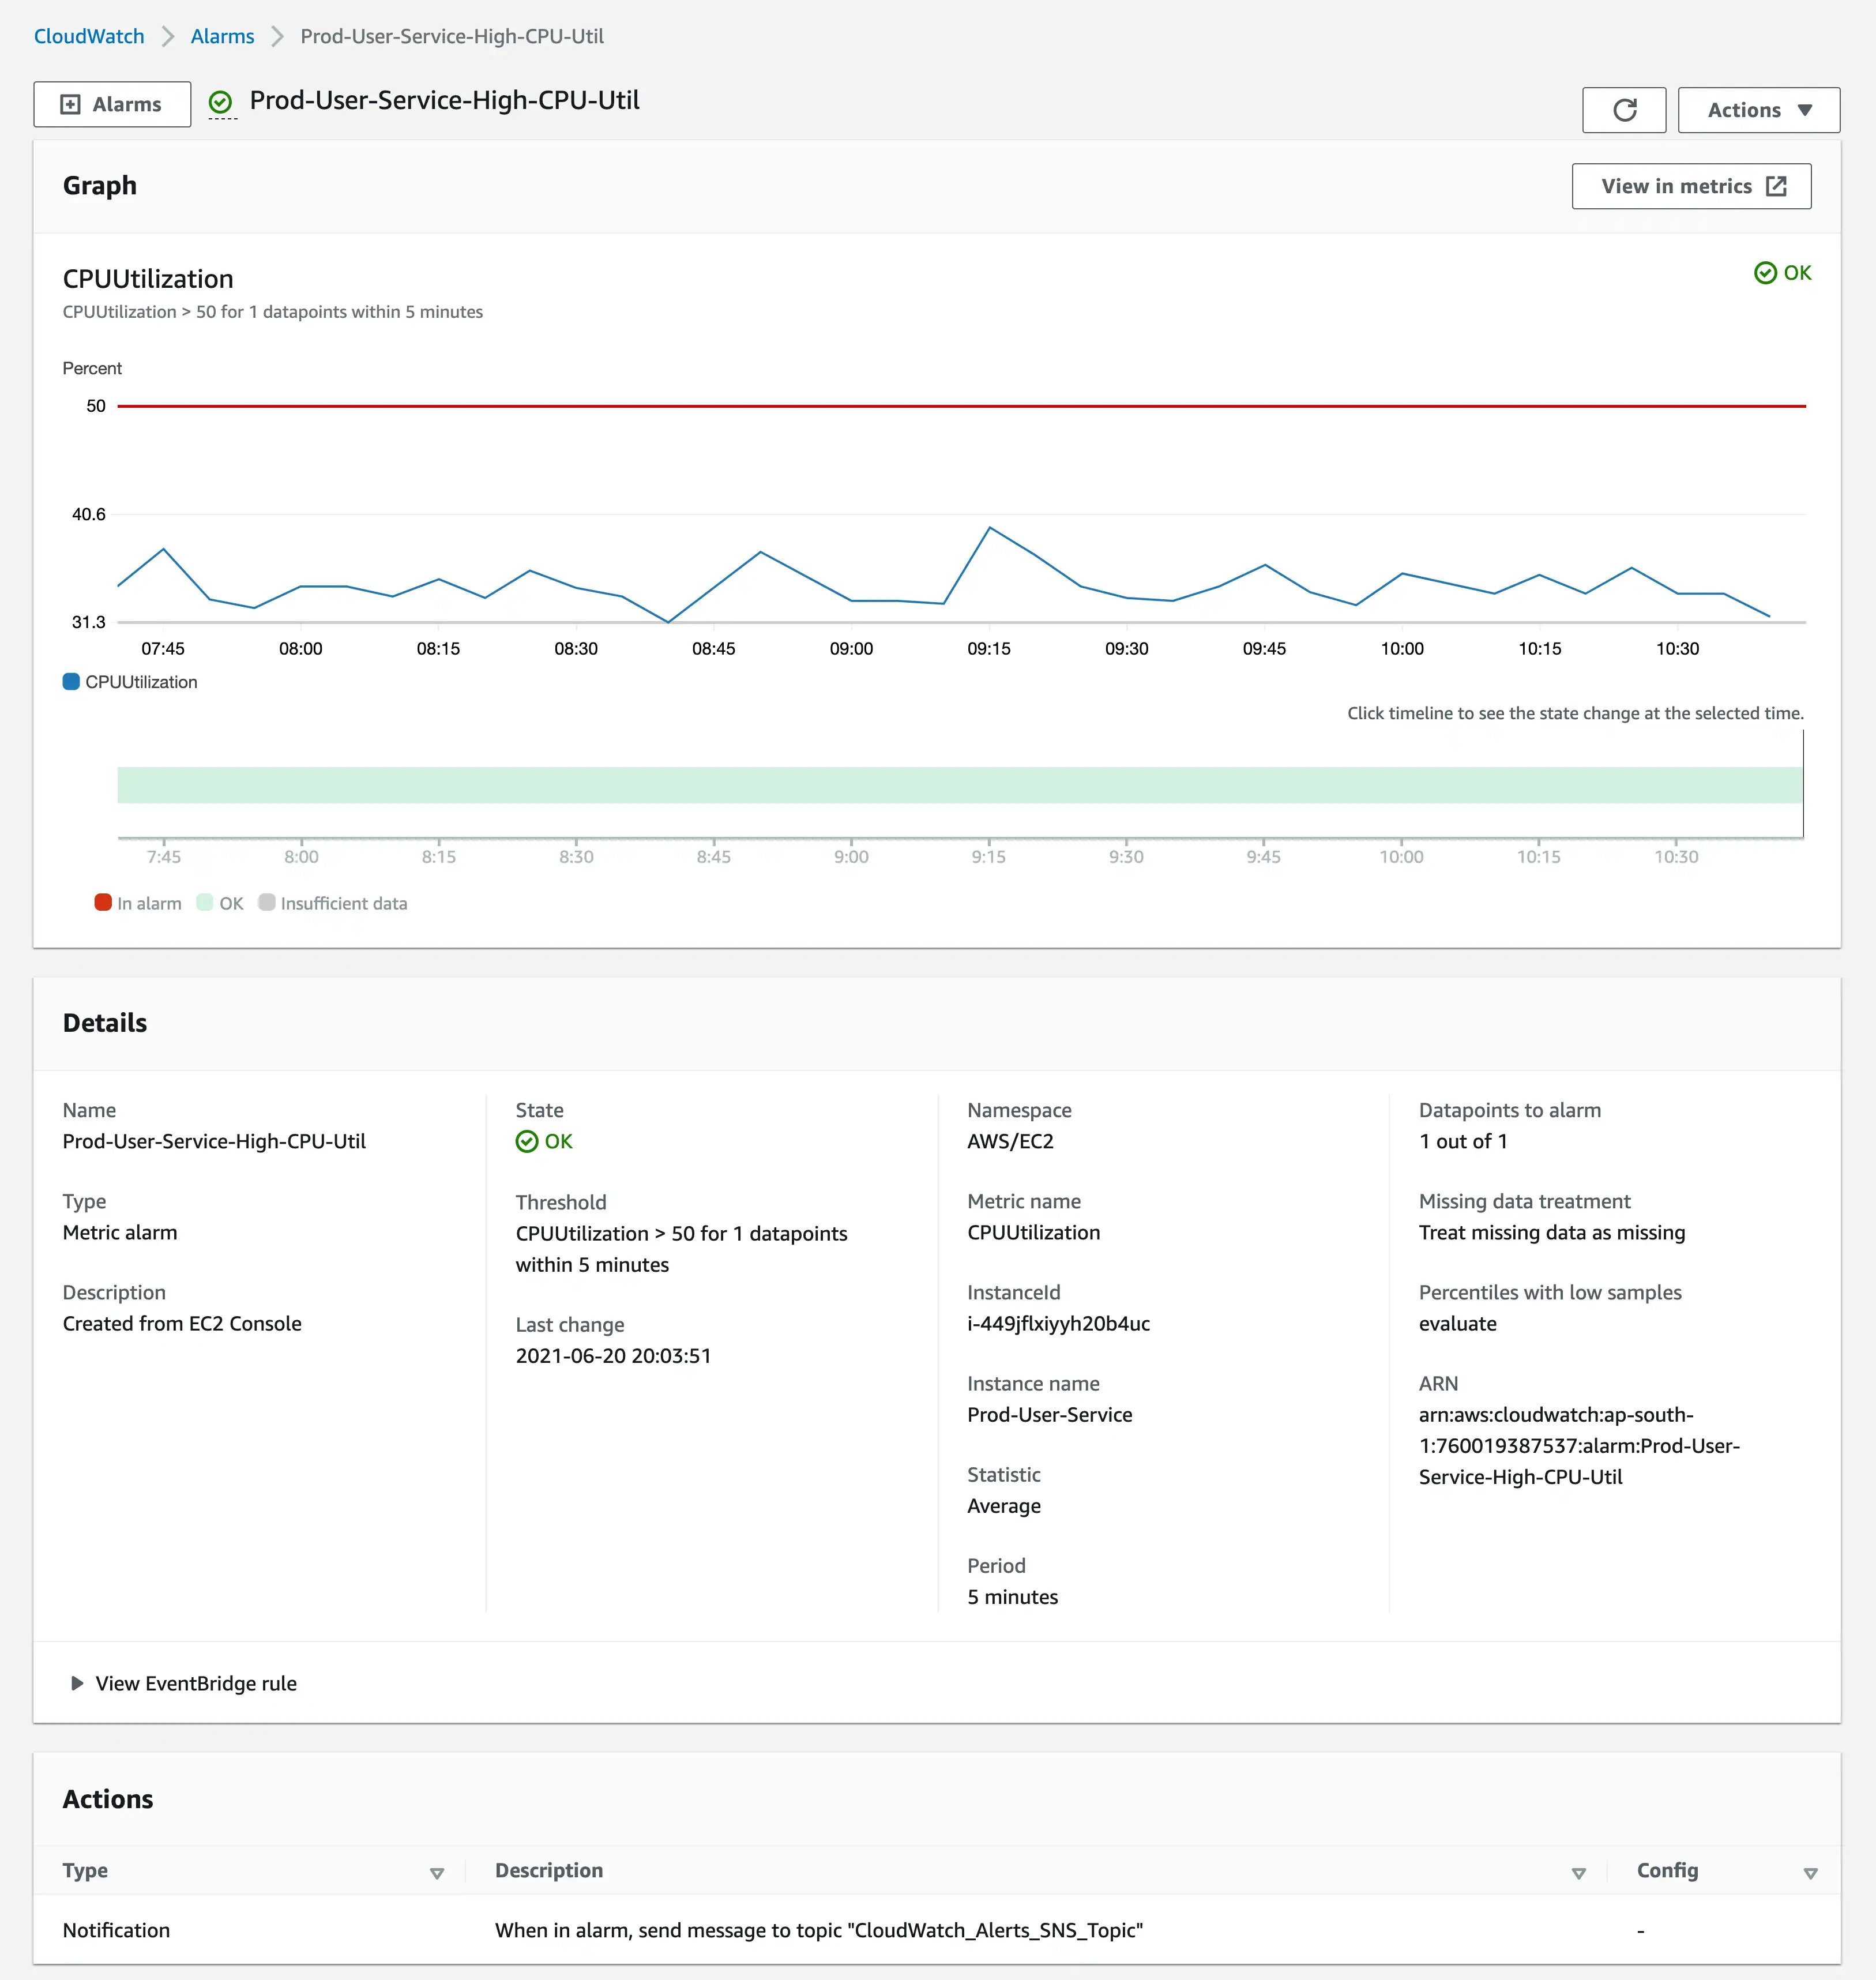
- Fill up the relevant numbers, select a SNS Topic for sending notification and create the alarm. This is how your alarm details should look like.
For getting Disk space and Memory Usage Metrics, you have to run monitoring scripts provided by aws. These scripts send data from the server to Cloudwatch.
Below are the steps needed for Ubuntu operating system.
- Install required Packages
sudo apt-get update -y
sudo apt-get install unzip -y
sudo apt-get install libwww-perl libdatetime-perl -y
- Download monitoring scripts
curl https://aws-cloudwatch.s3.amazonaws.com/downloads/CloudWatchMonitoringScripts-1.2.2.zip -O
- Extract the files
unzip CloudWatchMonitoringScripts-1.2.2.zip && \
rm CloudWatchMonitoringScripts-1.2.2.zip && \
cd aws-scripts-mon
- Do the IAM role configuration for your instance or create
awscreds.conffile with your credentials.
~/aws-scripts-mon$ cp awscreds.template awscreds.conf
~/aws-scripts-mon$ vim awscreds.conf
AWSAccessKeyId=YOUR-ACCESS-KEY-ID
AWSSecretKey=YOUR-SECRET-KEY
IAM Role or user should have atleast these permissions.
- CloudWatch:
List,Read,Write- EC2:
Read
- Check your file system and disk path mounted on
/location.
~$ df -h
Filesystem      Size  Used Avail Use% Mounted on
udev            7.7G     0  7.7G   0% /dev
tmpfs           1.6G  8.8M  1.6G   1% /run
/dev/nvme0n1p1  1.5T  2.4G  1.5T   1% /
tmpfs           7.7G     0  7.7G   0% /dev/shm
tmpfs           5.0M     0  5.0M   0% /run/lock
tmpfs           7.7G     0  7.7G   0% /sys/fs/cgroup
/dev/loop0       56M   56M     0 100% /snap/core18/1997
/dev/loop1      100M  100M     0 100% /snap/core/11187
/dev/loop2       34M   34M     0 100% /snap/amazon-ssm-agent/3552
/dev/loop3      100M  100M     0 100% /snap/core/11167
/dev/loop4       56M   56M     0 100% /snap/core18/2066
/dev/loop5       18M   18M     0 100% /snap/amazon-ssm-agent/1480
tmpfs           1.6G     0  1.6G   0% /run/user/1000
- You can perform a test run of disk and memory usage metrics without posting data to CloudWatch.
~/aws-scripts-mon$ ./mon-put-instance-data.pl --disk-path=/dev/nvme0n1p1 --disk-space-avail --memory-units=gigabytes --mem-util --verify --verbose
In this case we are using IAM Role Cloudwatch-DiskUtil-Monit instead of awscreds.conf file.
MemoryUtilization: 2.69999295720859 (Percent)
DiskSpaceAvailable [/]: 1450.1875038147 (Gigabytes)
No credential methods are specified. Trying default IAM role.
Using IAM role <Cloudwatch-DiskUtil-Monit>
Endpoint: https://monitoring.ap-south-1.amazonaws.com
Payload: {"Namespace":"System/Linux","MetricData":[{"MetricName":"MemoryUtilization","Unit":"Percent","Timestamp":1624457444,"Value":2.69999295720859,"Dimensions":[{"Name":"InstanceId","Value":"i-449jflxiyyh20b4uc"}]},{"Unit":"Gigabytes","Timestamp":1624457444,"MetricName":"DiskSpaceAvailable","Dimensions":[{"Name":"Filesystem","Value":"/dev/nvme0n1p1"},{"Name":"InstanceId","Value":"i-449jflxiyyh20b4uc"},{"Name":"MountPath","Value":"/"}],"Value":1450.1875038147}],"__type":"com.amazonaws.cloudwatch.v2010_08_01#PutMetricDataInput"}
Verification completed successfully. No actual metrics sent to CloudWatch.
crontabcan be used to set a cron schedule for metrics reported to CloudWatch. Let’s create a cron job that sends server metrics to Cloudwatch every five minutes.
~$ crontab -e
no crontab for ubuntu - using an empty one
Select an editor.  To change later, run 'select-editor'.
1. /bin/ed
2. /bin/nano        <---- easiest
3. /usr/bin/vim.basic
4. /usr/bin/vim.tiny
Choose 1-4 [2]: 3
- Add this line at the end of file and exit the editor
*/5 * * * * /home/ubuntu/aws-scripts-mon/mon-put-instance-data.pl --disk-path=/dev/nvme0n1p1 --disk-space-avail --memory-units=gigabytes --mem-util
This will be output, and your cron job will start sending data to Cloudwatch every 5 minutes.
crontab: installing new crontab
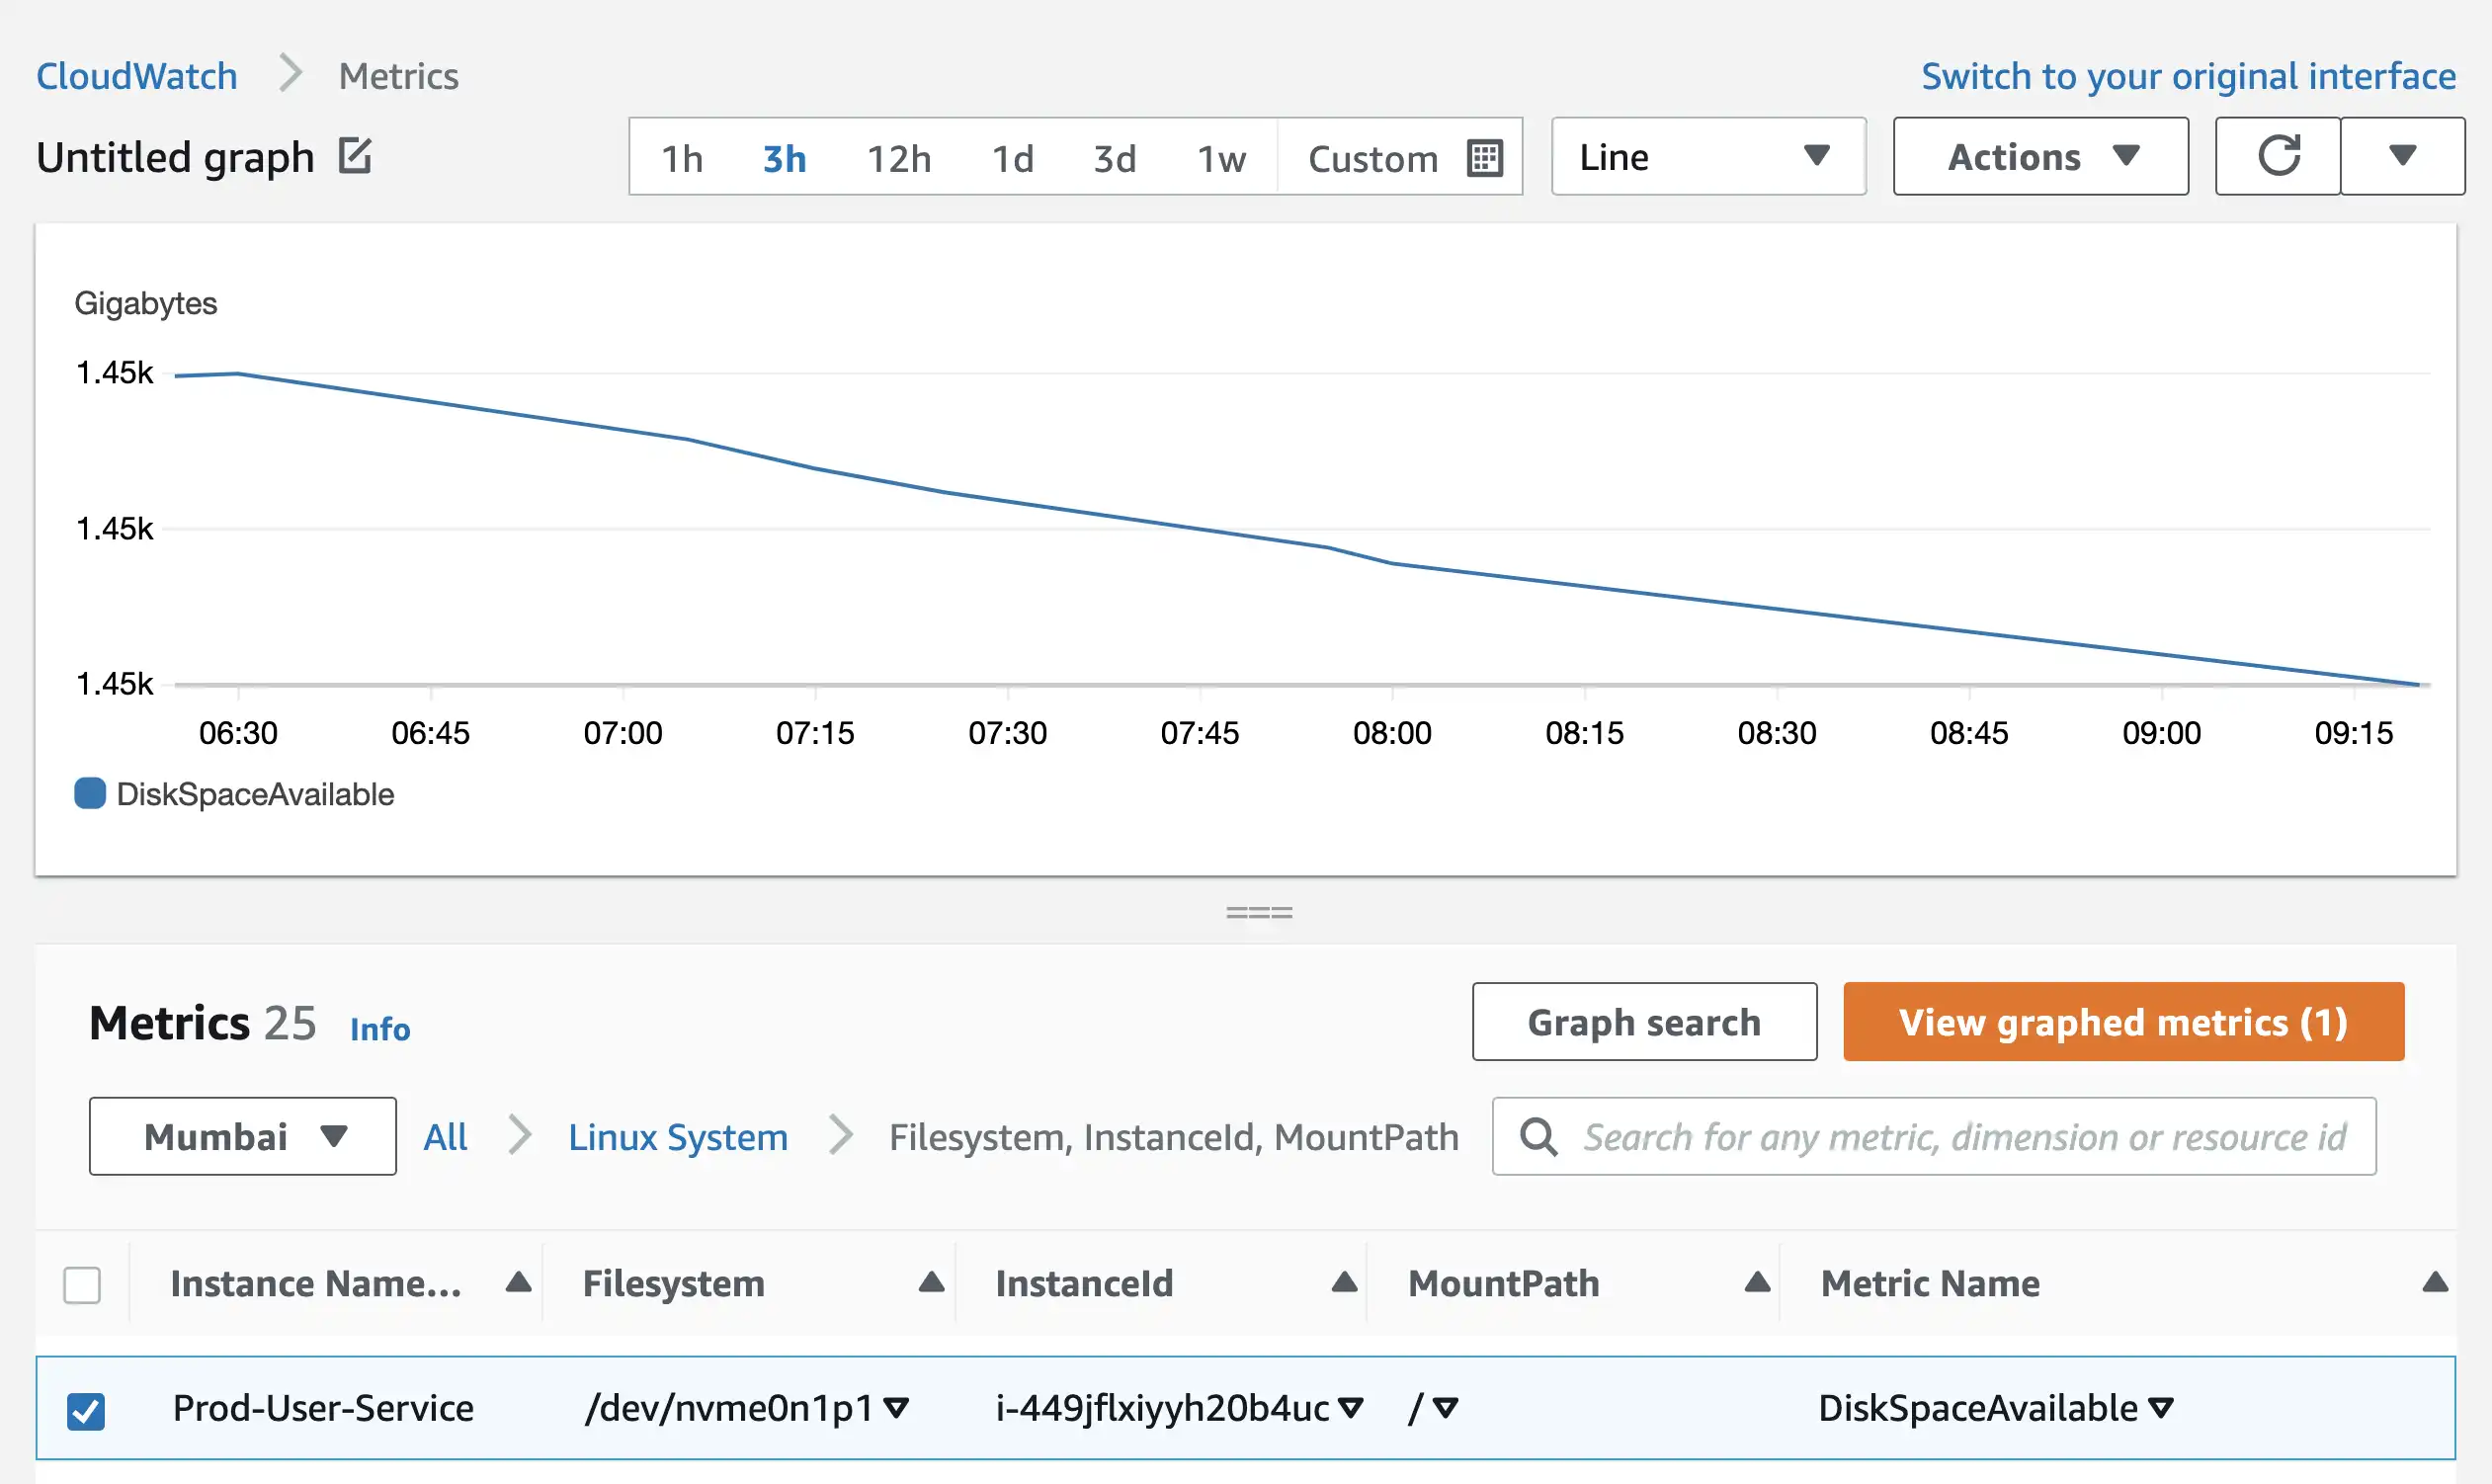
To View the Disk Space Availability and Memory Utilization of EC2 Instances you need to visit Cloudwatch Metrics Section.
Once the aws monitoring cron job starts exporting data to Cloudwatch, you will be able to see it in the Linux System subsection of Metrics Page.
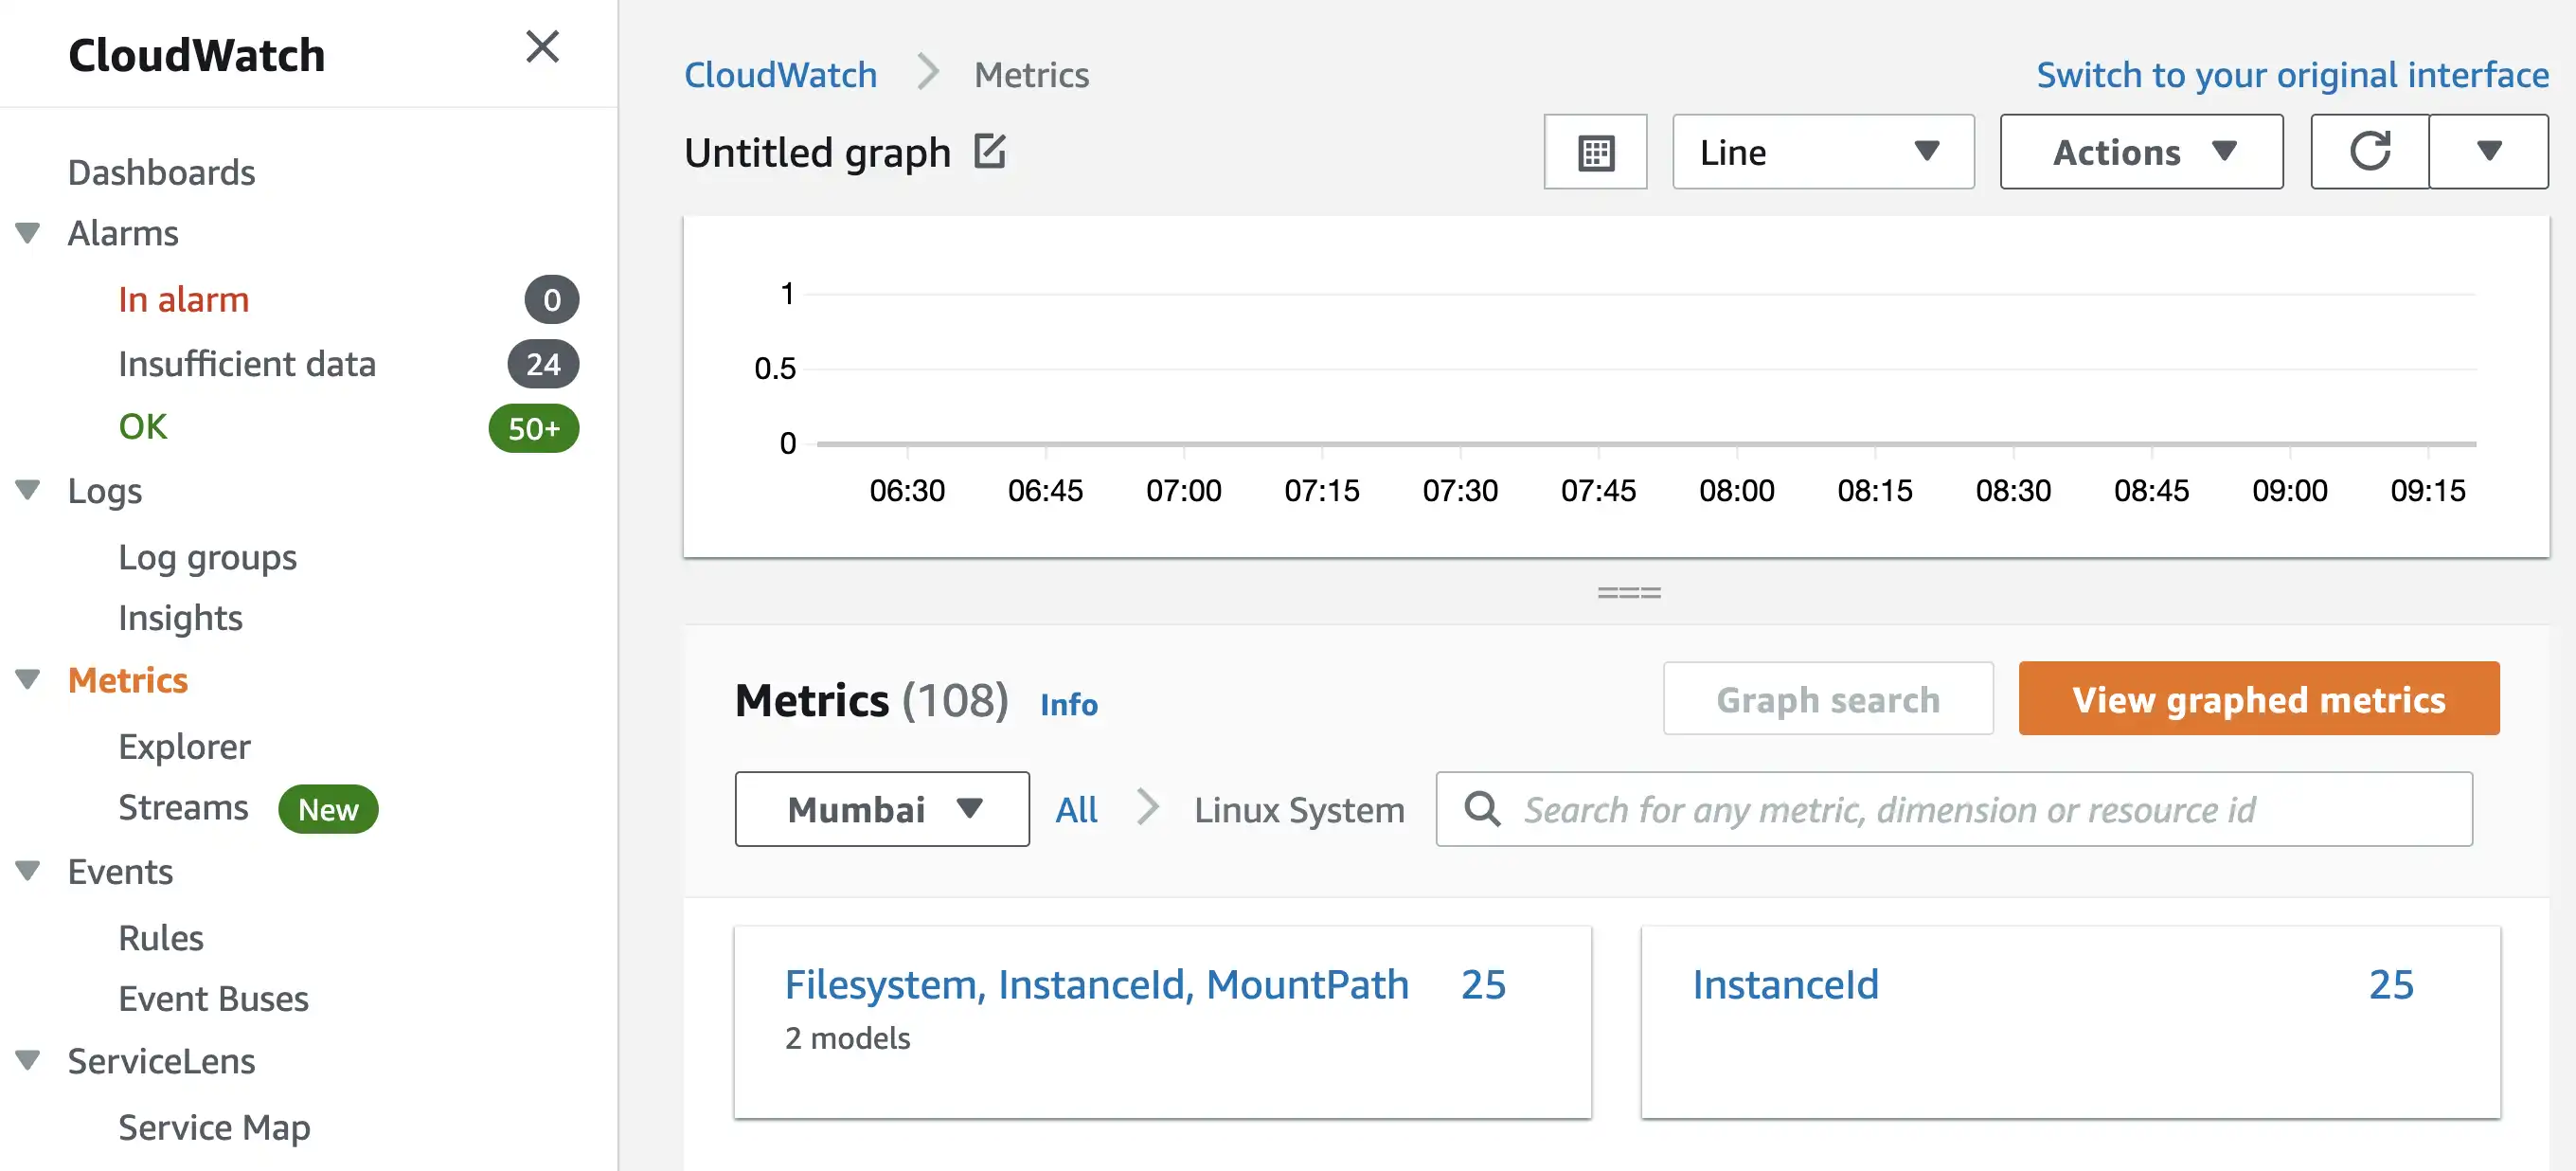
Disk space available metrics for all EC2 instances can be found in Filesystem, InstanceId, MountPath section.
Memory Utilization metrics for all EC2 instances can be found in the InstanceId section.
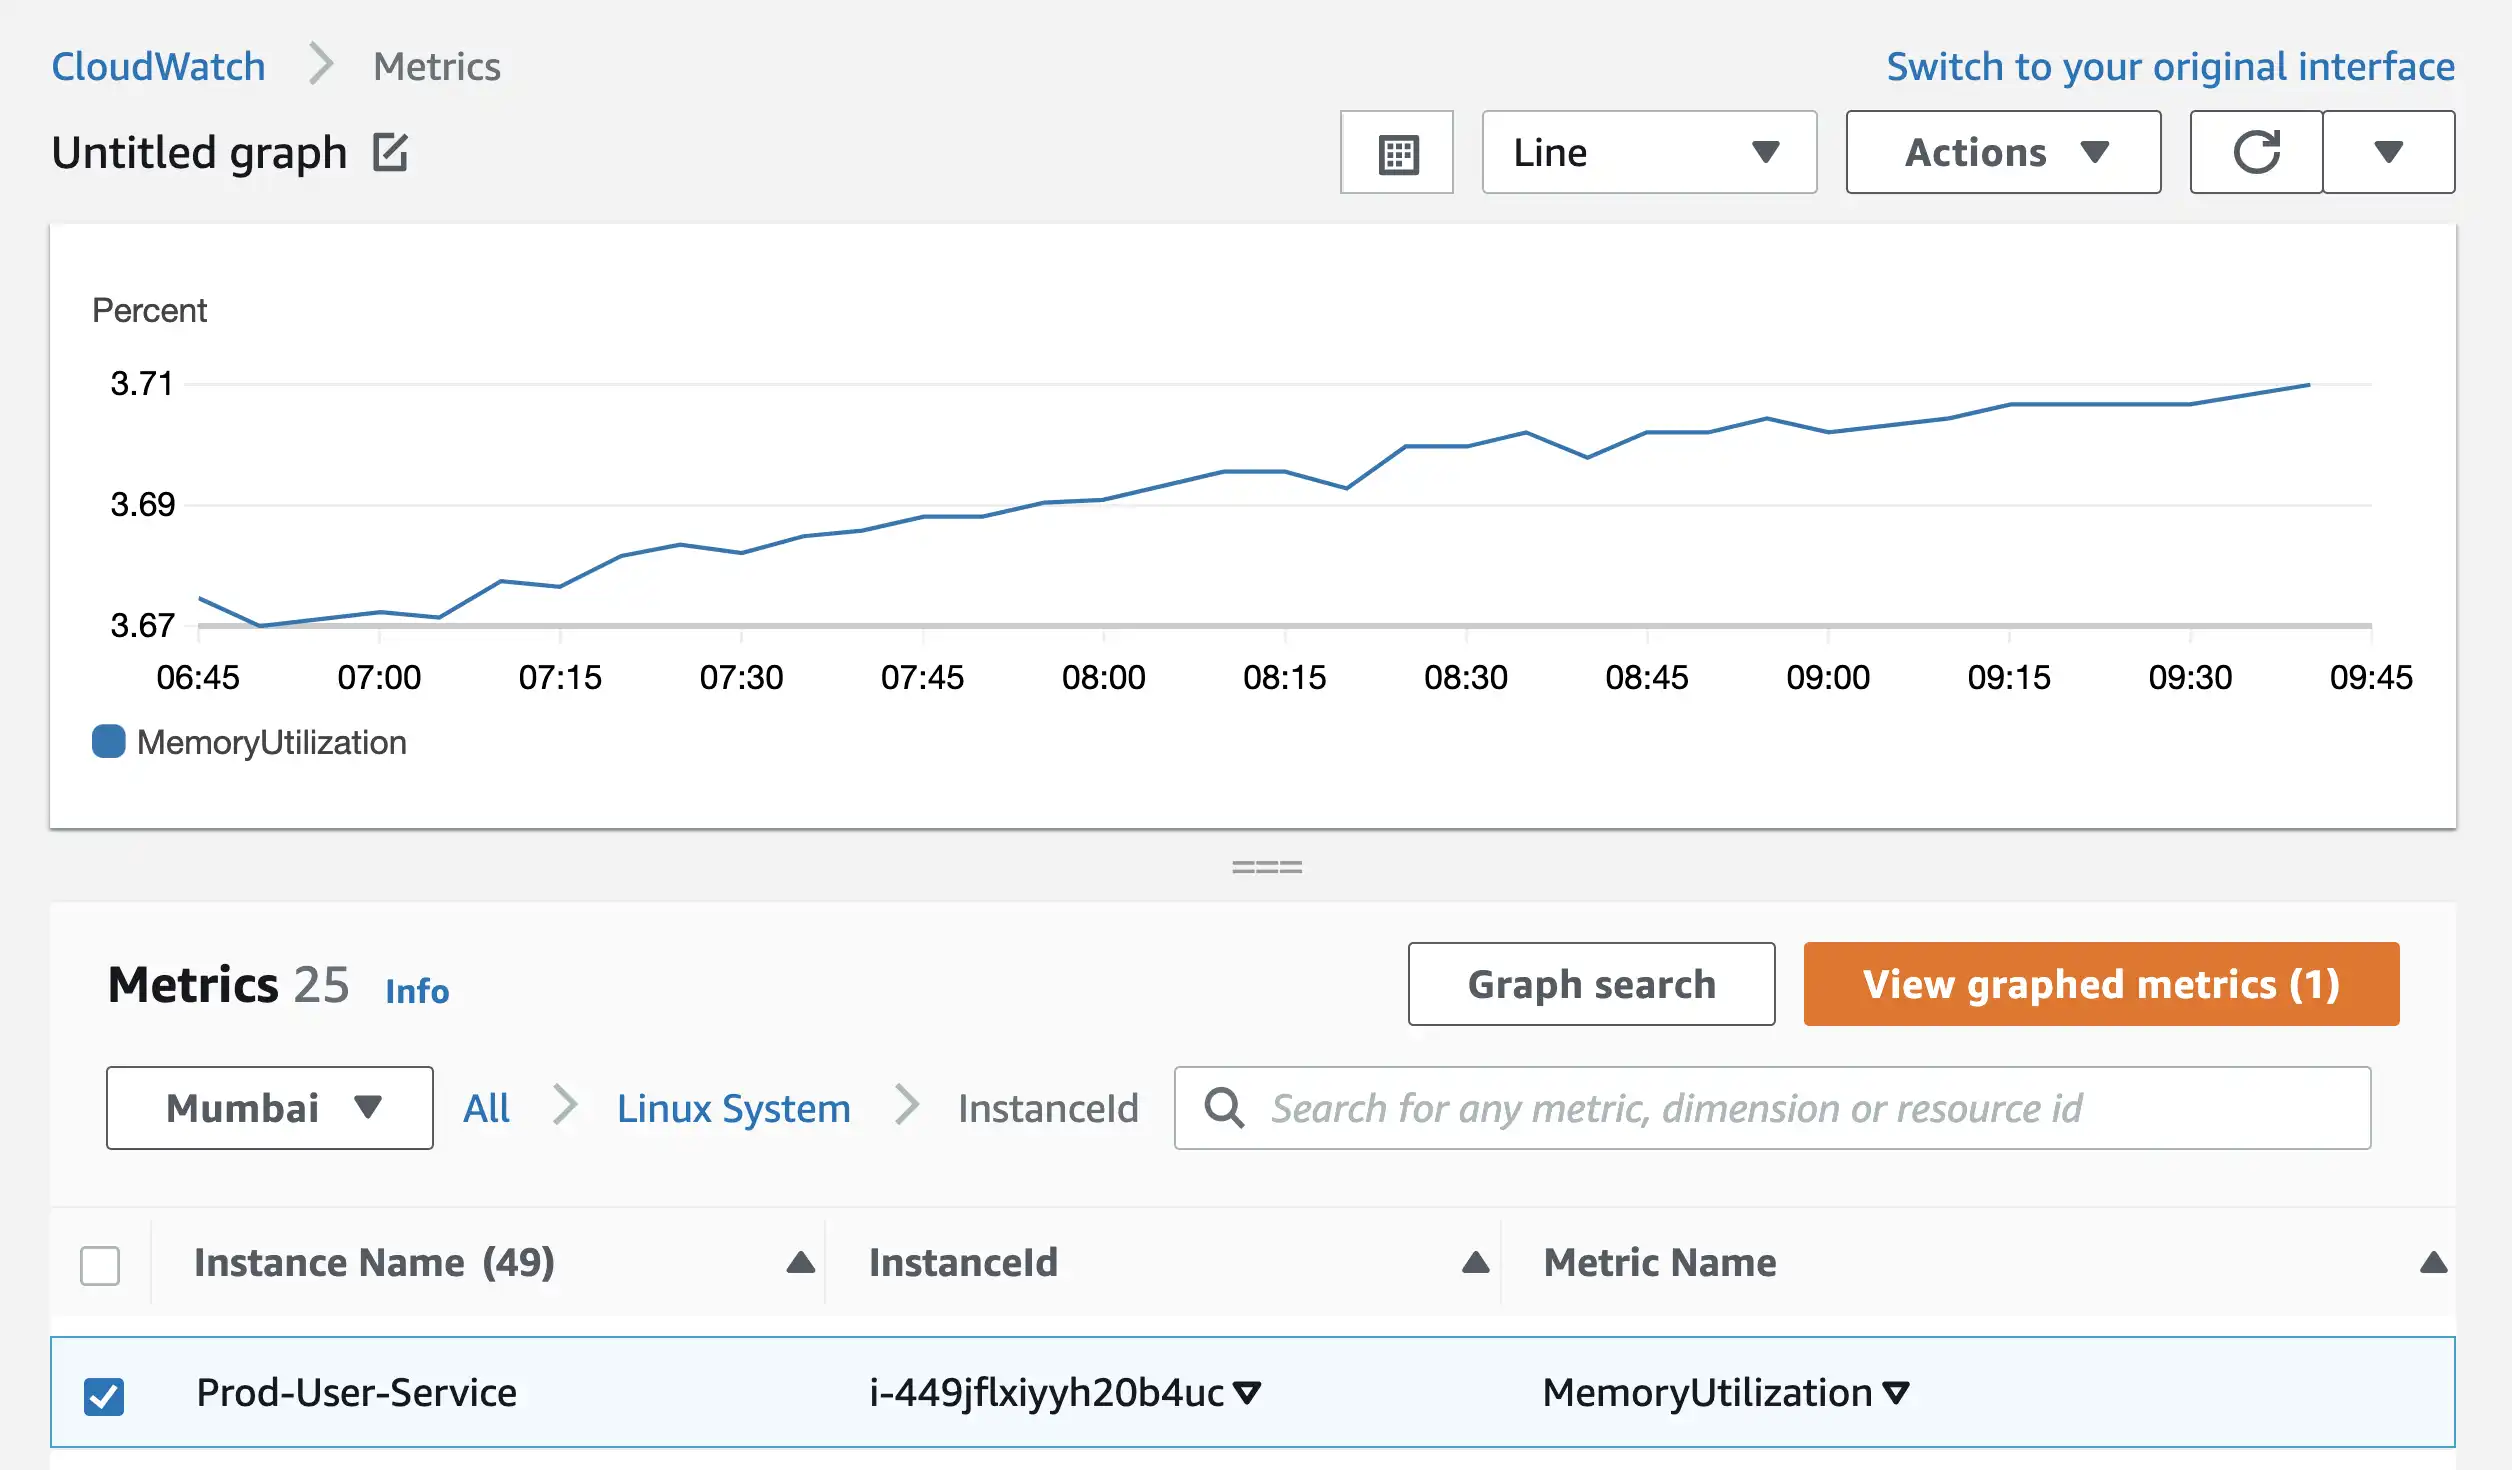
By clicking on View Graphed Metrics button, you’ll reach on same page where you can click on Bell Icon and create an alarm.
If you need to create alerts for multiple EC2 instances, this method can become tedious. For CPU, Disk, and Memory Alerts, you have to repeat the same process again and again.
A better way to tackle this issue is to write bash scripts for creating alerts. AWS provides command line interface for creating alerts. You can check official documentation for installing aws cli.
# You can add multiple AlarmName_EC2InstanceId combination in the alarm_names array
# There shouldn't be any underscore(_) in Alarm Name for this script to work

alarm_names=(Prod-User-Service-High-CPU-Util_i-449jflxiyyh20b4uc Prod-Order-Service-CPU-Util_i-638ctig47aftl2k49)

metric_name=CPUUtilization
statistic=Average
period=300
threshold=70
sns_topic=arn:aws:sns:ap-south-1:760019387537:CloudWatch_Alerts_SNS_Topic
unit=Percent
namespace=AWS/EC2

for i in "${alarm_names[@]}"; do
    IFS='_'
    read -ra temp <<< "$i"
    alarm_name=${temp[0]}
    instance_id=${temp[1]}
    aws cloudwatch put-metric-alarm \
            --namespace ${namespace} \
            --metric-name ${metric_name} \
            --dimensions "Name=InstanceId,Value=${instance_id}" \
            --statistic ${statistic} \
            --period ${period} \
            --evaluation-periods 2 \
            --alarm-name ${alarm_name} \
            --threshold ${threshold} \
            --unit ${unit} \
            --comparison-operator GreaterThanOrEqualToThreshold \
            --alarm-actions "${sns_topic}" \
            --no-actions-enabled \
done
The above script will sample the metric data every 5 minutes (300 seconds), and if the average CPU Utilization exceeds or equals 70%, it will send an event to the SNS Topic. You can subscribe to the SNS Topic via Email, Slack Channels, Pagerduty, or any other notification medium.
By changing the metric_name and namespace variables in the bash script, you can create Disk Space Availability and Memory Utilization Alerts with the same script.
metric_name=DiskSpaceAvailable
statistic=Average
period=300
threshold=10
sns_topic=arn:aws:sns:ap-south-1:760019387537:CloudWatch_Alerts_SNS_Topic
unit=Gigabytes
namespace=System/Linux
metric_name=MemoryUtilization
statistic=Average
period=300
threshold=70
sns_topic=arn:aws:sns:ap-south-1:760019387537:CloudWatch_Alerts_SNS_Topic
unit=Percent
namespace=System/Linux
You can tune the threshold and period parameters according to your workload. Using this method you can instantly create or update existing alerts for all your EC2 instances instantly.
#aws #script #backend #scaling